While benchmarking a custom concurrent functor queue against standard library containers, I noticed something that I didn’t expect.
The common concern about the standard containers, especially ones such as std::list, std::map and std::queue, is their poor behaviour in terms of memory allocations. These structures are well known for allocating tons of tiny objects. Frequently, those concerns are downplayed by argumenting that modern memory allocators are well optimized to support these structures. This argument actually seems to hold up, except, until it doesn’t.
My benchmark initially went through different setups of lambdas with 2 large strings in the capture list getting pushed into and popped from different queue containers. One test, sequentially pushing all, and then popping all of 8 million entries. The next doing the same, but on multiple threads. The last test, pushing and popping on multiple threads all at the same time. At first, I didn’t notice anything suspicious. My specialized container was largely outperforming the standard containers. Good for me.
Then, I let the whole set of tests, all being run from a single process, repeat itself 16 times. That’s when something looked way off.
These results were obtained on Windows 10 version 1909, using Visual Studio 2019 version 16.6.5, on an AMD Ryzen 5 2600 with 32GB RAM.
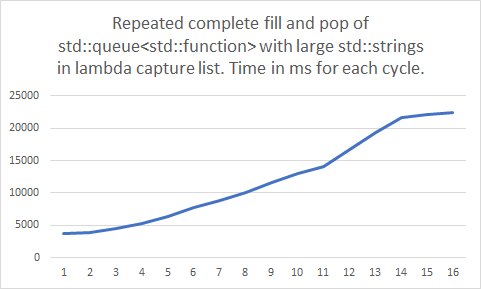
Most of the benchmarks got slower over time! Not just by a little bit. They slowed down by a lot! The ones that were not affected, were the benchmarks which were doing the push and pop operations all concurrently. Or, in other words, the benchmarks that didn’t allocate a lot of memory didn’t noticeably slow down. It was only the benchmarks doing a large amount of memory allocations that slowed down over time.
Could it really be? Standard library containers are really that bad? I ran the single threaded benchmarks for each container separately, to validate my assumption. The testing code is available on GitHub.
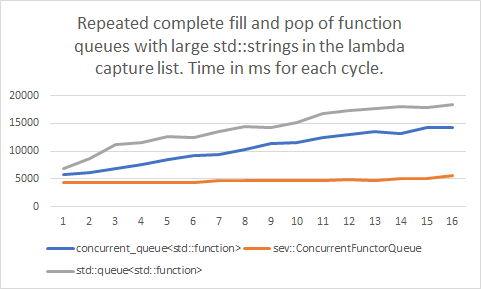
While I always assumed STL containers were rather bad for performance critical use, for use in games especially, I couldn’t believe it was really this bad.
My custom container, which allocates memory in larger fixed blocks, and serially writes functor objects into those blocks, was barely affected. The standard containers, which allocate individual objects for each entry that’s added, slowed down dramatically over time in the benchmark.
It obviously appears that the STL containers are causing some heavy memory fragmentation here. Or, at least, causing the memory allocator to break down in performance, at some point, in some way or another.
A couple of days later, I reviewed my benchmark. Actually, the testing code had the new and delete operators replaced by a custom implementation to keep track of the allocation to ensure there are no memory leaks anywhere. Just a simple atomic counter, though. The allocation was implemented using _aligned_malloc and _aligned_free. I removed these custom implementations, and ran the tests again, just to be sure my benchmarks were correct.
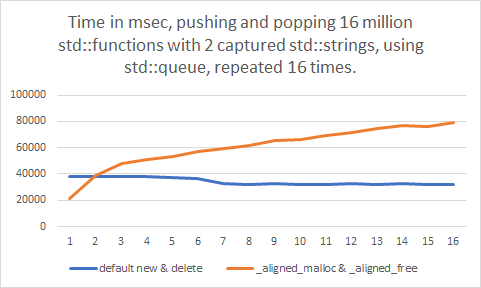
Oh, no! After all this time, _aligned_malloc was the culprit? The slowdown just disappeared entirely! I tried putting the custom new and delete operators back in again, this time with regular malloc. The result remained the same. No more slowdown either. Even more, the new benchmarks actually appeared to go faster over time!
Something was clearly off with _aligned_malloc here. Or was there?
I wondered. What if I roll my own aligned allocator on top of malloc? Just pad the size, align the pointer, and store the original pointer. That shouldn’t be much slower than when directly calling malloc…

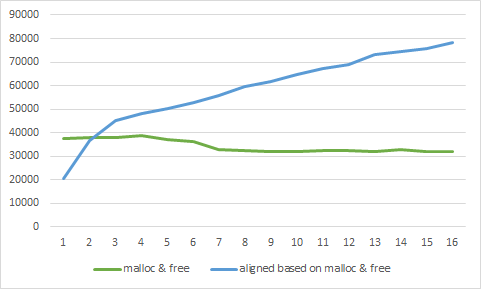
Uhh. That doesn’t look right. Or, well, maybe it does? Exactly the same result as with _aligned_malloc. What is going on here? It’s nothing more than a slightly larger allocation, isn’t it?
I changed the benchmark to increase the capture list to 3 strings, instead of the original 2 strings, and also reverted back to the malloc implementation which had no slowdown in the previous test.
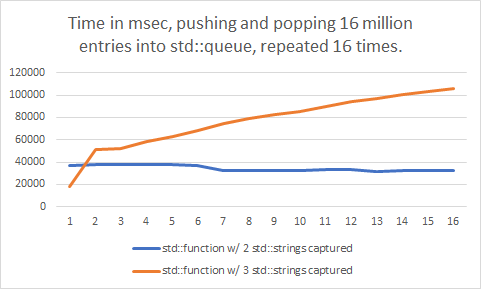
Slightly larger memory allocations, both causing a massive slowdown over time? It’s even worse than before. What is going on here?
It was time to look deeper. I wrote a simple test to directly benchmark the malloc function. Allocating a large amount of memory with varying small sizes, again repeating the test 16 times, following a FIFO allocation and freeing behaviour to match the queue containers’ behaviour. All of the tests showed huge slowdowns by the last round. But none of them showed good performance, so this gave no indication of what was triggering it.
In a next set of tests, instead of varying the allocation size, I varied the total amount of memory to allocate in each testing cycle.

There it is! The slowdown consistently gets triggered just past the 4GB total allocation mark. But, why? Does this always happen, or are small allocations really the culprit after all? Are large allocations immune, or not?
Repeatedly allocating 2GB and below was showing no problems at all. At just over 4GB the decay slowly started to become noticeable, but once at 8GB the performance dropped like a brick over time.
Using the worst-case total allocation size of 8GB, I varied the allocation sizes again. This time trying out larger allocation sizes, as the tiny allocations from one of the earlier tests all resulted in a similar performance slowdown. The testing code is available in case you want to verify these results.
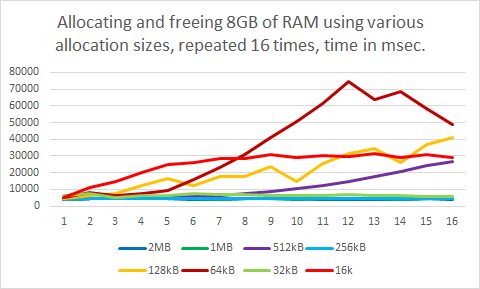
You might’ve fairly expected that the results would make some sense. The larger allocations of 1MB and above were fast, and didn’t appear to be causing any performance issues over time. And the smallest allocation size tested caused a rather significant slowdown. Makes sense.
Once the test went below 1MB, to 512kB allocations, the slowdown slowly but visibly kicked in. So far, so good.
But here’s the part where it got interesting.
At 256kB, just another drop down to the next lower power-of-2, memory allocations became fast again! Without any sign of performance issues.
How could that be? Going down further to 128kB the performance slowdown appeared yet again, and at 64kB the memory allocations even peaked, getting up to 10 times slower! But, then, going for an even smaller allocation size of 32kB, once more all performance issues were suddenly gone. And once at 16kB and below, where the LFH (low fragmentation heap) kicks in, the slowdown issue came back, but with a different curve, and even earlier.
Where 512kB, 128kB, and especially 64kB sized allocations were causing massive performance slowdowns over time, allocations of 32kB and 256kB remained blazingly fast in comparison. I have found no explanation for these specific values.
In this test, all allocation sizes were clean powers-of-two. According to a presentation on the Windows heap, which I found online, allocations have a header padding of 16 to 32 bytes. I could confirm this behaviour by logging a sequence of allocated addresses.
000002A7C4118B50
000002A7C4120B60
000002A7C4128B70
000002A7C4130B80
000002A7C4138B90
000002A7C4140BA0
What if I’d simply subtract 32 bytes from the power-of-two sizes? The abovementioned presentation document also mentions that remainders of 32 bytes in allocation blocks are not recycled into the heap for smaller allocations, so this appears to be a safe value to use.
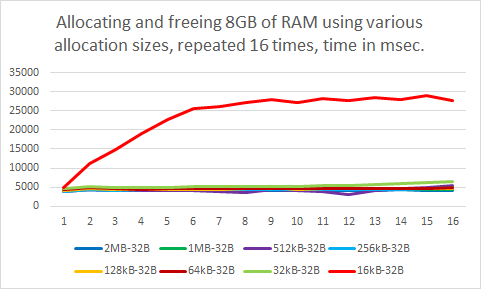
That actually worked! No more significant performance slowdowns, except for the 16kB minus 32 bytes allocation.
As mentioned before, allocations of 16kB and lower are handled by the LFH according to its documentation. The performance graph for the 16kB allocations in the previous test was also noticeably different in shape compared to the other graphs, which confirms that this is indeed the case.
I wondered if the allocation sizes which didn’t suffer from this issue would end up getting affected when the slowdown does occur due to other allocations, so I ran another test for this case, alternating between allocating 8GB in blocks of 64kB, and blocks of 64kB minus 32 bytes.
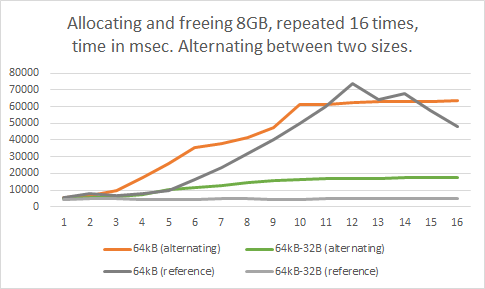
Based on this test, it seems the slowdown that’s caused by problematic allocation sizes does slightly affect the performance of other allocations which normally wouldn’t show this issue. However, the better allocation sizes still did keep showing better performance overall than the worse allocation sizes in all cases.
In short, small allocations below 16kB are actually optimized to be pretty fast. Until they reach over 4GB in total size. Then, performance gets slower and slower over time, even if you free all the allocated memory in your process.
So, don’t allocate more than 4GB of RAM using allocation sizes of 16kB and below, and avoid allocating exactly 64kB, 128kB, or 512kB. Ideally, allocate memory in 1MB or larger memory chunks, or allocate powers-of-two minus 32 bytes (minus 80 bytes in debug mode, due to a 48 bytes additional debug header) for smaller allocation sizes above 16kB. Aligned allocation functions pad your allocation size, which needs to be taken into account. A 64kB allocation size turns out to be the worst performer of all.
Hi, I’m Jan, also known as Kaetemi in the online world. I am working on LibSEv, a simple event loop library with optimized support for C++ lambdas, a clean C interface, and C++ exception safety. Buy me a coffee through Patreon if you’d like to support this project!
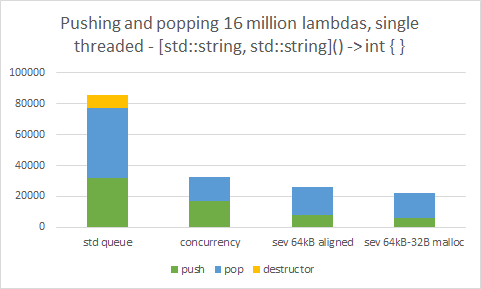
I actually happened to be using just that allocation size, 64kB, as the default allocation size in my custom container. After modifying my custom functor queue to allocate 32 bytes less than a power-of-two block, performance was indeed significantly boosted. The test intentionally creates a large amount of std::string instances to ensure that the performance slowdown was in effect in all results in this chart.
Looking further through the documentation on the Windows heap, I came across the HeapCompact function. It appears this function merges empty sequences of fragmented memory together.
Could this be it? I adjusted the test to call HeapCompact(GetProcessHeap(), 0) inbetween each testing round.
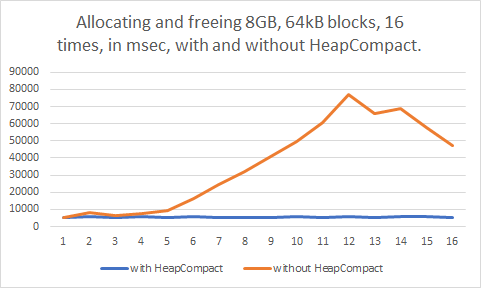
Problem fixed. I guess? At least, when it’s called whenever the allocated memory gets below the 4GB marker again. It took only 10 milliseconds to call this function in my tests, too. Perhaps it might be a good idea to call this function occasionally in software projects, whenever possible. For example, it could be called before and after loading screens in a game, or before and after loading a project or document in a productivity application.
It turns out heap fragmentation still is a real issue, and can occur even in unexpected situations. Memory allocation sizes do have a significant effect in solving the associated performance issues. But when staying within certain limitations there is really none-to-little measurable effect of any memory fragmentation that STL containers may or may not be causing, although there still is the fixed overhead of simply making more allocations. Allocators are actually pretty well optimized for this usage. Benchmarks of STL containers can be wildly deceiving.
The following rules-of-thumb seem practical, as tested on Windows 10 version 1909, using Visual Studio 2019 version 16.6.5.
- Don’t allocate more than 2 to 4GB of total memory in small sizes.
- Prefer allocations of 16kB and below for short-lived small size allocations.
- When possible, avoid allocations of 16kB and below, and of exactly 64kB, 128kB, or 512kB.
- If you absolutely need a power-of-two, allocate memory in sizes exactly 32kB, 256kB, or 1MB and up.
- Otherwise, use an allocation size that’s a power-of-two minus 32 bytes (or minus 80 bytes in debug.)
- Call
HeapCompact(GetProcessHeap(), 0)before and after voluminous operations.
These results are Windows-specific, and the specific measurements do not apply to other operating systems. However, following the above recommendations should not negatively affect your performance on other operating systems. If in doubt, run your own benchmarks.
If you liked this article, you might also enjoy my 6-part series on reverse engineering the 3ds Max file format. Have fun reading!
A selection of the test results in this article have also been tested and reproduced on an AMD Ryzen 7 3700X with 32GB memory, running Windows 10 version 2004, using Visual Studio 2019 version 16.7.1.


Thanks for sharing this useful information! Hope that you will continue with the kind of stuff you are doing.